
“There is no worse mistake in public leadership than to hold out false hopes, soon to be swept away.”
Most kitchen and bath business owners don’t know how well they are doing. Their showroom may be full of prospects due to the boom the industry has seen during this post-Covid remodeling demand, and their checking accounts may be flush with cash deposits, allowing them, naturally, to feel successful. Though truthfully, they are half-blind to the actual performance of their business if they are not regularly generating benchmarking reports. If they were, their financial statements may not reflect the great success they think they’ve become.
Finding out your actual standing within the industry — or more particularly the SEN Design Group community — is the key to knowing what your priorities for improvement should be, and what assets need to be developed or acquired to fulfill those next steps. That’s why benchmarking reports are so valuable. They wake you up to where you are today, and to new heights of prosperity of where you could be tomorrow.
Get benchmark reports to improve your business from the inside out
The value of benchmarking reports is to recognize the importance of comparing your company to the highest known metric standards that have been attained by others.
Generating annual benchmarking reports will lead your company to better its bottom line and fatten your personal investment accounts. These are things anyone would want to do, but sadly many just don’t take the time to do them.
Many dealers look more successful than they are: nice showroom, good local reputation, late model car, designer clothing, and a platinum credit card. But how many are really making a substantial return on their investment and risk?
Selling a $250,000 kitchen remodeling job is a very good sale, but it isn’t inherently evident of success. Comparing your financial statements to other dealers in the industry is just as important as landing a big client.
Crunching the numbers to know the true standing of a business sounds like a no-brainer, though so many owners let an expensive car and a beautiful showroom show how well their business is doing instead of explicitly knowing its true financial position. Perhaps they’re worried about what their metrics will actually reveal: that their business isn’t doing as well as they think it is.
Know your economic driver
There is a myth believed by many people running businesses in the kitchen and bath industry that “sales” is their economic driver. It’s logical to think in those terms because sales are what’s needed to stay open and have a positive cash flow. But it is not the most significant driver. There are, however, critical elements of expense and success that are common to all.
An economic driver is the single key factor that has the most significant influence on the growth and profitability of a company.
The economic driver of a kitchen and bath firm can be determined by taking the gross profit dollars of a business and dividing it by the company payroll (including the owner’s salary and payroll taxes for all). SEN arrived at this definitive conclusion by studying 71 years of financial data furnished from 14 firms throughout the country, representing a variety of business models.
SEN also determined that kitchen and bath firm owners should gun for an economic driver metric of 2.2. That’s because the study revealed a compelling 92% probability that these firms’ highest net profits were achieved when their gross profit dollars were 2.2 times greater than their gross payroll expense.
Understand the financial basics
In order for you to be on the level with the numbers your business is truly producing, it’s recommended to follow the process outlined below.
Understand what financial statements measure. The two important reports to comprehend are the income statement and the balance sheet. While simple math, the names and their meanings can easily be confused.
The income statement measures a company’s performance for the most recent 12 months:
Total Income – Total Expenses = Net Profit (or Loss)
On the other hand, the balance sheet measures the company’s financial performance since it started in business:
Total Assets – Total Liabilities = Net Worth
Know your economic driver metric. In order for you to have more control over the direction and functionality of your business, you first need to know the hard numbers your business is doing. Break out your income statements for the last 3-5 years (the more the better!). Get them on the table and go over them thoroughly.
Calculate the gross profit dollars divided by your payroll expense factor for 2017-2020. The quotients arrived from each calculation are your economic drivers for each year. Take note of how many times the largest factor also coincided with your highest net profits.
Request a free FINTEL benchmarking report
Improve your control over the direction of your company by knowing its hard numbers. SEN members may receive an annual FINTEL benchmark report free of charge. This multi-page, computerized report will give you a “before” appraisal of your company’s performance that you can compare with an “after” appraisal to measure 12 months of tangible progress.
SEN has invested in a customized FINTEL report that includes at least two special metrics that are important to kitchen and bath firms:
- Financial Leverage Multiplier (FLM) — which measures the use of other people’s money to acquire assets. That members can command 50% deposits for use as working capital makes this metric a key one to monitor, because if the leverage gets too high, your company won’t have the monetary resources to survive a severe downturn. (Formula: Total Assets ÷ Net Worth).
- Economic Driver — measures the productivity of your personnel team. (Formula: Gross Profit Dollars ÷ Gross Payroll Expense).
For those of you wisely taking advantage of FINTEL’s reporting service, I’ll forward you your report, we’ll arrange a 30-minute meeting to clarify the findings, and I’ll answer any questions you may have. Then I’ll assist you in prioritizing the next right steps for your firm to take to achieve your desired financial improvement goals.
All financial reports and benchmarking results are kept in STRICT CONFIDENCE. But they are used in a compilation report for the benefit of all SEN members.
Success is measured through comparison. Your FINTEL report results, along with those of other SEN members, creates a baseline by which to gauge your firm’s success. Once you know the true standing of your company, you can begin to take the steps needed to leverage for greater profitability.
Leverage your reported metrics for greater profitability
Suppose your report tells you that your gross profit margin is 32.3%, while other SEN members average a 37.95% GPM (a true statement). That means your SEN colleagues are earning 17% more GPM per job!
To validate: 37.95% – 32.30% = 5.65% —> 5.65% ÷ 32.30% = 17%
So, that $100,000 kitchen you sold was a $117,000 sale for higher performing SEN members. You can’t make that extra $17,000 without increasing your GPM! And you can’t earn a higher price without losing the sale, unless your company is perceived as a better value.
There are three important steps to follow that will assist you in leveraging a higher GPM:
- Discover your correct price formula. If you want to make more revenue on each job you sign, you first have to know what the pricing formula should be for the overhead of your business model. You’ll find out what your gross profit margin needs to be in order to make an 8%-10% pre-tax net. You can learn this at the SEN Business School. Contact Skyler Ille at sille@sendesign.com to sign up.
- Learn and apply the GBB sales process. The second step will lead you and your team to price jobs for prospects in minutes on three tiers — good, better, best — of project quality. The GBB sales process is also featured in our SEN Business School. Mastering this client-loving sales process will enable your team to potentially double their revenue and increase their gross profit margins simultaneously!
- Set up and use DesignAlign technology on a daily basis. Finally, once your team has a command of the GBB sales process, master the DesignAlign platform. This too is covered in the SEN Business School. Using DesignAlign can lead your firm to a 100% annual sales increase, getting prospects to commit in half the time, and charging up to 40% higher prices!
Zero in on doing what you are great at and wealth will follow
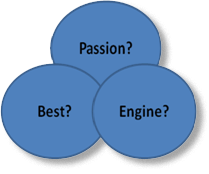 In his 2001 bestseller, Good to Great, author Jim Collins referred to successful companies as operating within “The Hedgehog Concept.” In keeping with the findings of the research documented by Collins, kitchen and bath firm owners going forward would be wise to make certain that all their business growth endeavors fall within the intersecting circles as shown in the graphic below.
As long as you stay true to your passion (creating designs as personal as your clients’ signatures), do what you can do best in your marketplace (educating consumers on how kitchen and bath costs add up leveraging the DesignAlign platform), and optimize your key economic driver (Gross Profit ÷ Gross Payroll), you will outperform the competition many times over for a sustained period of time, making a lot of profit in the process.
Indeed, leveraging the combination of just three SEN Assets — (1) Benchmark Reports, (2) SEN Business School, and (3) DesignAlign platform — can transform your business into an engine for genuine wealth.
—John Lang LPBC, SEN Design Group