
“Foresight it’s not about predicting the future, it’s about minimizing surprise.”
It is said that the best business leaders are constantly looking into the future to determine what must be done in the present. It is also said the future can’t be predicted, and anybody telling you they know what’s going to happen next is either fibbing or doesn’t realize they’re not telling the truth. While it is true — no one can truly predict the future, there are things that kitchen and bath owners can do to help accomplish their revenue goals. Sales forecasting is a dynamic, reliable way of projecting year-end income based upon trending metrics. Be diligent in your business practices every year and you will develop systems and processes that are smart and effective. Have a quick look at sales forecasting for an overview.
Tracking Key Performance Indicators
In SEN’s view, kitchen and bath design firm owners should be tracking three key performance indicators (KPIs) of their business monthly:
- Leads
- Sales orders (equivalent of signed contracts)
- Income (the value of substantially completed projects under accrual accounting that shows up on your profit and loss statement).
Leads = Appointments
It’s healthy to think of leads as opportunities to sign contracts.
A lead is an inquiry that has made a face-to-face appointment with one of your sales designers, resulting in their becoming a qualified opportunity. This transition occurs after your sales designer has contacted the lead and covered three points of interest with them:
- Talked with the lead about your design development process
- Invited them to see the products on display in the company or virtual showroom (your website)
- Secured an appointment for either a showroom visit or virtual consultation
That’s when an inquiry should be considered an actual lead!
Establish a win likelihood for each stage
Conscientious sales forecasting should give you a fair expectation for the likelihood of new business at every stage along the way.
For example, take a look at the four stages of sales forecasting and their likelihood of closing on the project:
| Stages | Win % Likelihood |
| Incoming leads | 10% |
| Qualified leads (secure 2-hour showroom appointment) | 25% |
| Interactive Good-Better-Best Budget | 70-75% |
| Final presentation of plan & price | 100% |
Six steps to sales forecasting
Step #1: Dig into lead records
You can develop a strong lead forecast by reviewing your historical lead records. Go back as far as possible. A data record of the most recent ten years is ideal. If you don’t have ten years of records, two to three years is a good start. As you add the lead results for each successive year, you will become a better sales forecaster.
Begin by generating a document to see your work clearly and save the files for your records. Then, create a formal historical lead record with the number of leads secured per month. Drop off any leads for the oldest year to maintain the latest ten year results.
Step #2: Establish monthly percentage of leads
The objective is to determine what percentage of leads were generated in each month of the year. Add up the leads in January over those X number of years. Then divide that January total by the total of all leads to get the percentage of leads that January typically delivers for your company.
Use the data you have. Going forward, you can sharpen your forecasting system with new data.
Step #3: Calculate sales orders to get your lead ratio
Here is an example:
| Sales orders | = | $4,350,000 | = | $4,812 Sales/Lead |
| Leads | 904 Total Leads | On average |
Here, sales orders are the same value as signed contracts in a given month.
Dividing the total sales orders over three years ($4,350,000) by the total leads registered over the same years (904) tells us that the company will generate $4,812 sales orders — on average — from each lead.
Step #4: Project the year’s lead goal
| Sales Orders Goal | = | $1,710,000 | = | 356 Leads |
| Avg. Sales/Leads | $4,812 | Goal |
If our sales order goal for the coming year is $1,710,000, you will need 356 leads to support that goal. That number is determined by a simple equation of the $1,710,000 sales goal, divided by the historical average sales per lead of $4,812.
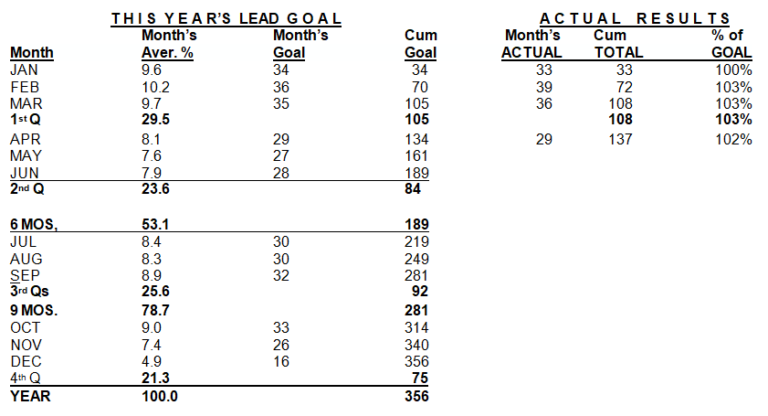
Step #5: Create a lead forecast chart
Now create a lead forecast chart by applying the monthly percentages you’ve logged into the chart for the lead goal of the coming year.
- Post the lead goal for each month, and strive for your team to achieve that monthly goal!
- Then post the actual results per month when they occur, and note any discrepancies. If January typically produces 9.6% of the year’s total leads, multiplying 9.6% times the 356 year-end goal requires 34 leads in January to have your marketing and sales team
Since June is on target to generate 7.9% of the leads, a total of 28, by Q2, your company will have to produce 189 leads (53.1%) to be on track by mid-year.
be on course for the overall goal.
Step #6: Repeat the first two steps for sales orders and income
- Update your historical records for (a) sales orders, and (b) income, just like you did for leads
- Then apply the same % per month methodology for the two other KPIs
Referring to the lead forecast chart below, you will want equivalent ones for sales orders ($1,710,000 goal) and income ($1,500,000 goal) to (a) post actual results each month for all three KPIs, (b) post cumulative totals for all three KPIs, and (c) record % of cumulative goal achieved for all three KPIs.
Managing by the percentages
Once these three forecasts have been completed, you can literally manage your operation by the percentages. At the end of every month, you will be able to project year-end totals for each indicator by taking the cumulative actual total and dividing it by the average cumulative percentage. Let’s consider what remedial action would be needed if a company faced the following results after four months:
| Item | Period | Cum. % | Cum. Goal | Cum. Actual | Year-End Projection | % of Goal |
| Leads | Thru April | 37.6% | 134 | 137 | 364 | 102% |
| Sales Orders | Thru April | 32.0% | $547,200 | $508,600 | $1,589,375 | 93% |
| Income | Thru April | 26.2% | $393,000 | $323,100 | $1,233,206 | 102% |
The leads are there in quantity, though the designers are not closing enough of them.
Additional sales training should be considered for the company to achieve its income goal of $1,500,000. If this gap isn’t closed quickly, it will be necessary to cut additional overhead to avoid a possible year-end loss.
Scale up your operation with SEN Business School
Do you want to earn up to 40% more per job? Keep an eye out for 2022 dates, and join SEN members who have already leveraged SEN Business School!
Content covered during our four-day program includes the following but is not limited to:
- How to develop a three-year budgeting process: your blueprint for success
- How to present the shock-proof method of price presentation so you can charge more for your projects in support of earning the desired 10% pre-tax net profit SEN advocates
- Packaging a presentation to win bank financing
- Communicating to your team the way they listen: how leveraging DISC assessments can get you better-than-expected results out of your staff
- How and when to branch out to satellite showrooms to scale your operations
The SEN Design Group is the only industry-specific resource that teaches how the three key disciplines of finance, marketing, and sales are to be integrated and leveraged. By mastering these three key disciplines, you will unleash a powerful positive impact on your business’s bottom line that will be amplified a number of times over!
SEN Executive Business School is for you if you are a business owner, partner, or general manager who is truly serious about scaling your kitchen and bath design operations! Reach out to Shannon Blair at sblair@sendesign.com to put your name on the waiting list for 2022.
—The SEN Leadership Team